
I’m quoted in a short piece this week by Josh Nicholas on the Guardian datablog, arguing we could have predicted the local government areas hit hardest by the Covid-19 pandemic — before the second wave outbreak.
About a week prior I undertook a similar analysis of the Sydney outbreak, using maps and data from the Social Health Atlas published by PHIDU. Here’s an expanded version walking through the interpretation and findings.
Step 1: Mapping Disadvantage
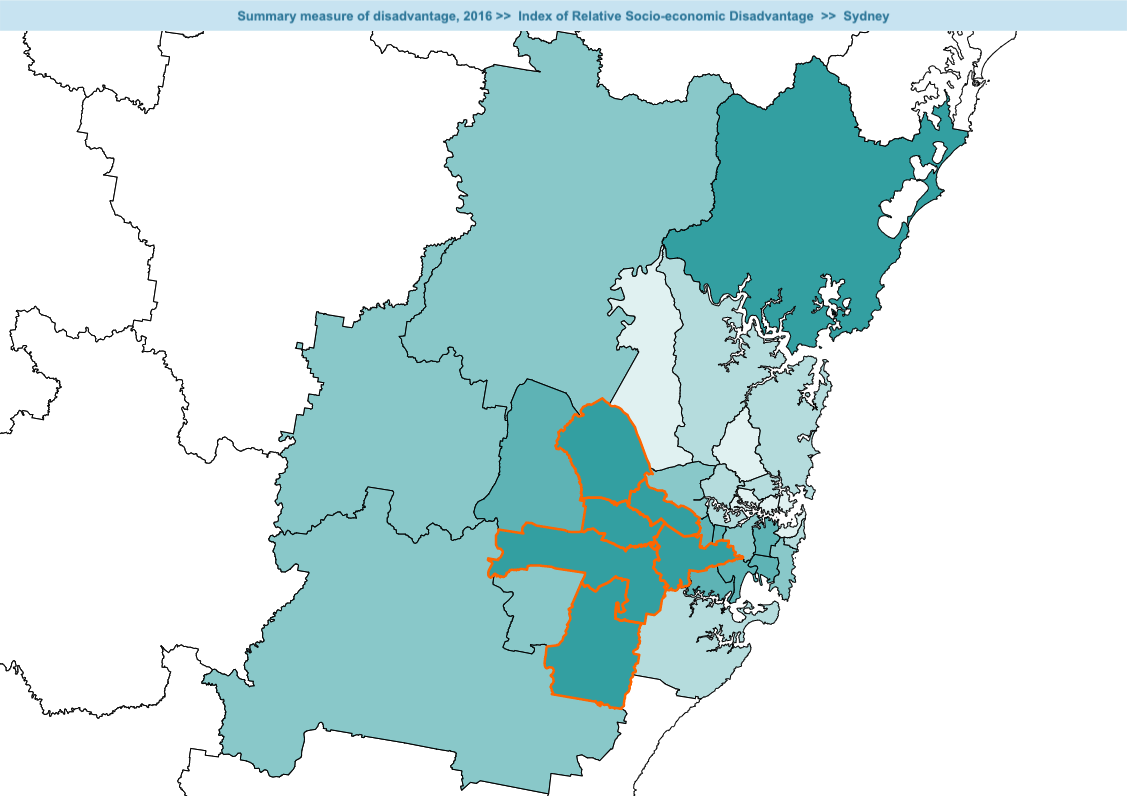
This map shows local government areas (LGAs—basically council regions) shaded according to their standing on the ABS’ Index of Relative Socio-Economic Disadvantage (IRSED). Darker = more disadvantage. I’ve highlighted the Sydney urban LGAs that are more disadvantaged than the Australian average. They form a recognisable clump in Sydney’s western suburbs.
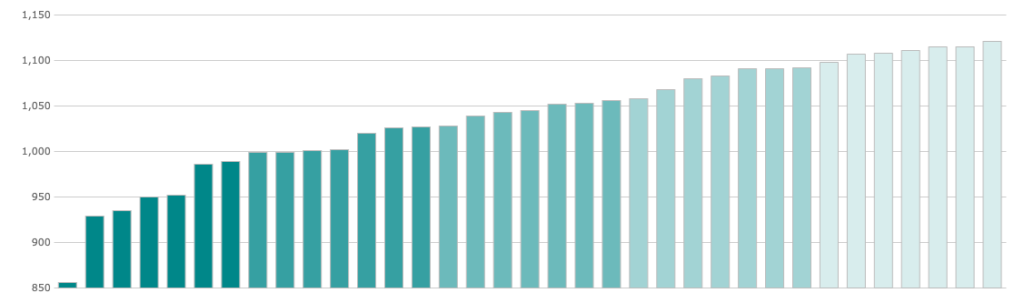
And here’s a plot of the IRSD scores:
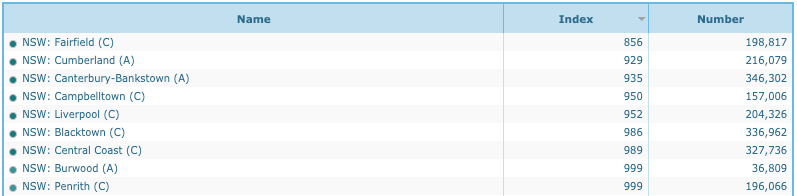
The table identifies the LGAs we’re talking about:
Are those LGAs beginning to sound familiar from the daily pressers?
- Fairfield
- Cumberland
- Canterbury-Bankstown
- Campbelltown
- Liverpool
- Blacktown
- Burwood
- Penrith
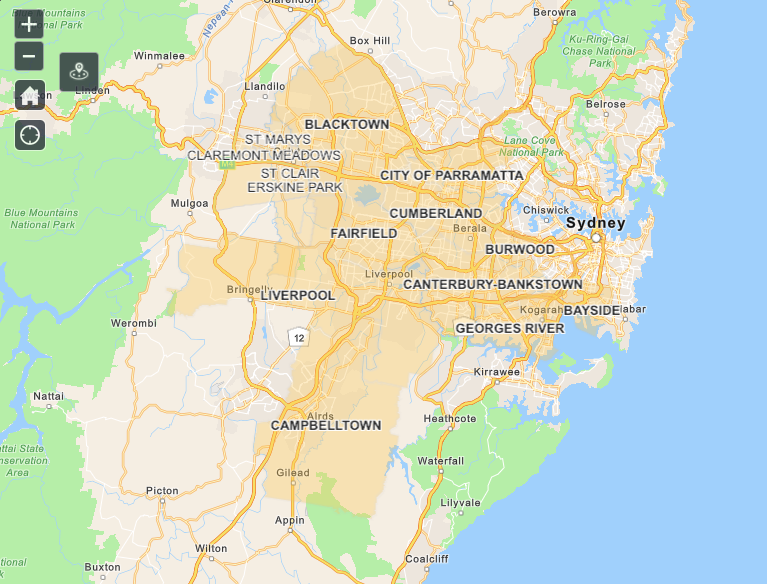
In case they don’t, maybe some maps will jog your memory. Here’s the same cluster from the NSW Government’s LGAs of Concern web page:
Here’s the same map as rendered by Nine News. Great work, guys.
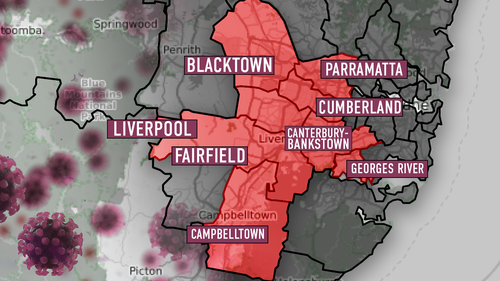
So without any specialised analysis we can see that Covid-19 incidence correlates with disadvantage.
That’s not a one-off. We saw the same thing in the Melbourne analysis:
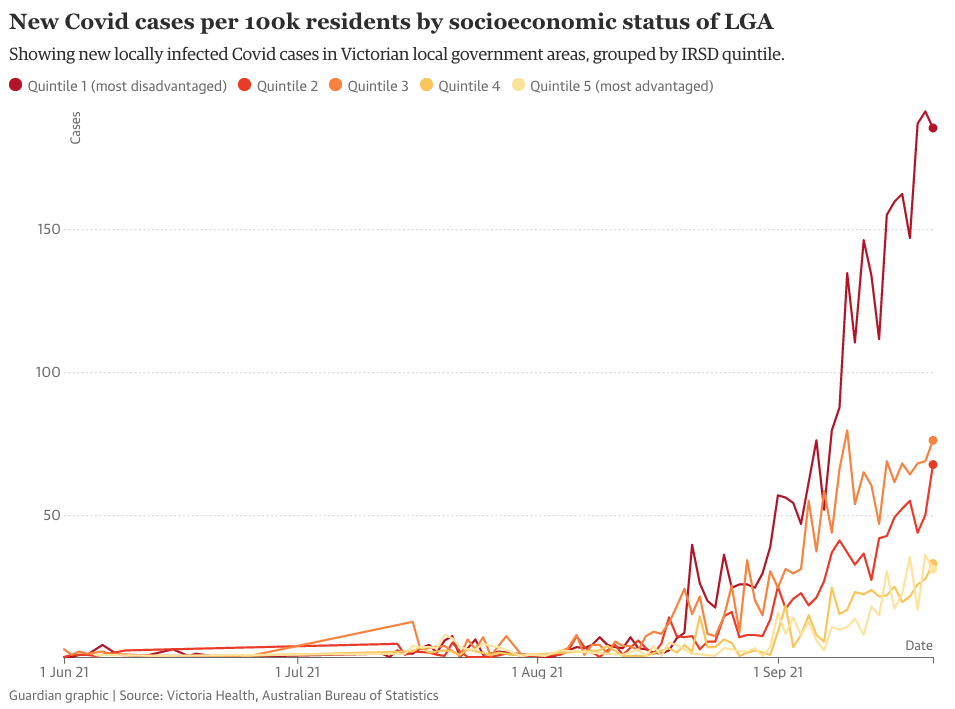
So this poses an important question. Could we have used this knowledge to intervene ahead of the outbreaks, preventing cases and saving lives? That depends on whether we should have known that health and illness often correlate with disadvantage at an area level. Here’s the data on that question.
Step 2: Other health outcomes
In this section I’m going to take that map of disadvantaged LGAs and put it alongside maps of differences in other health and illness outcomes, such as participation in cancer screening, so we can see whether the correlation holds.
I freely note that I’m cherry-picking for significant differences, and that’s fine: we only need to see this pattern a few times to be put on notice that it might recur with Covid-19, and make enquiries and take precautionary measures.
First, participation of eligible women in cervical screening (top map) is shown above a map of relative disadvantage (the map from earlier in this post).
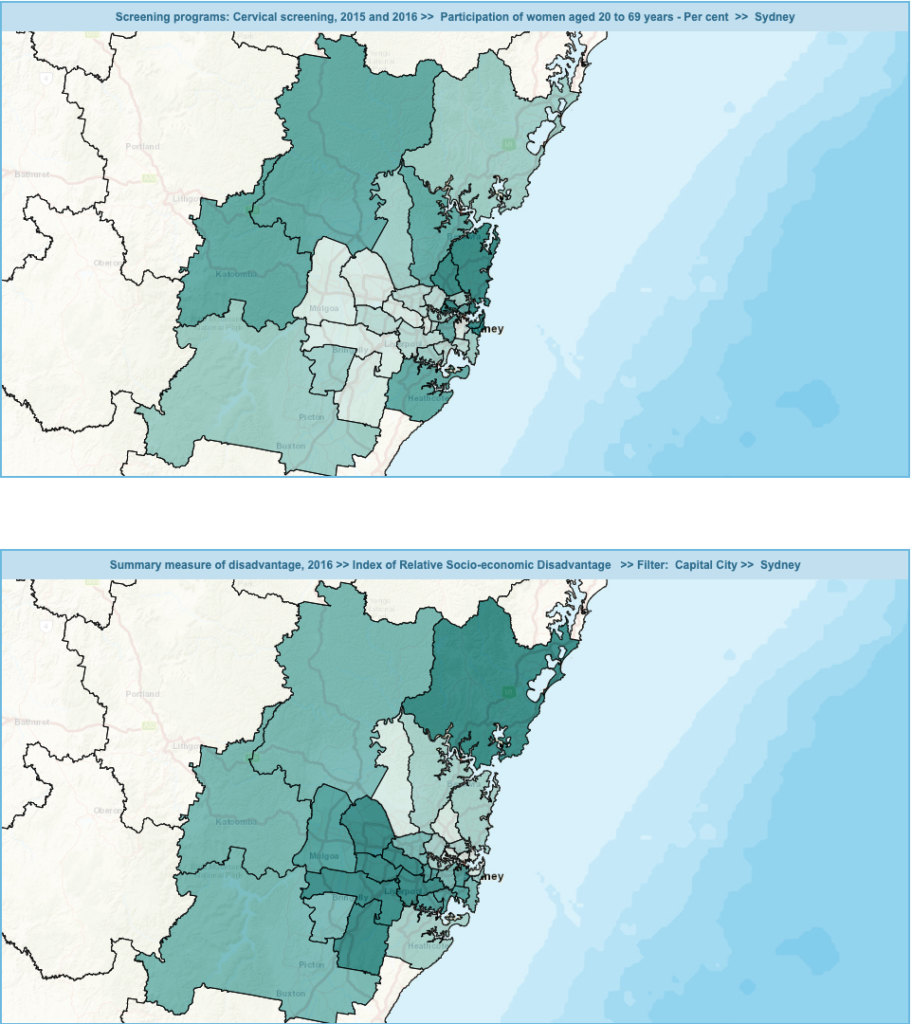
You can eyeball the two maps and spot a strong negative correlation. Helpfully, the Social Health Atlas offers a simple regression:
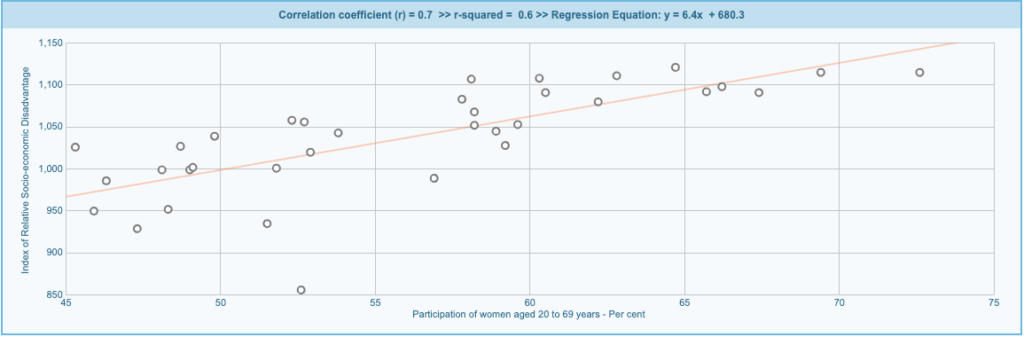
There’s a 70% correlation, suggesting* relative disadvantage explains about 60% of the total variation in cervical screening participation rates.
(* This is just a two-variable linear regression—a proper regression would bring in other variables and interactions that would no doubt reduce this score.)
For breast screening the pattern is the same but the correlation is weaker, only 30%. But for bowel screening we have a 50% correlation (30% explained):

I want to conclude by showing one obvious and one counter-intuitive example.
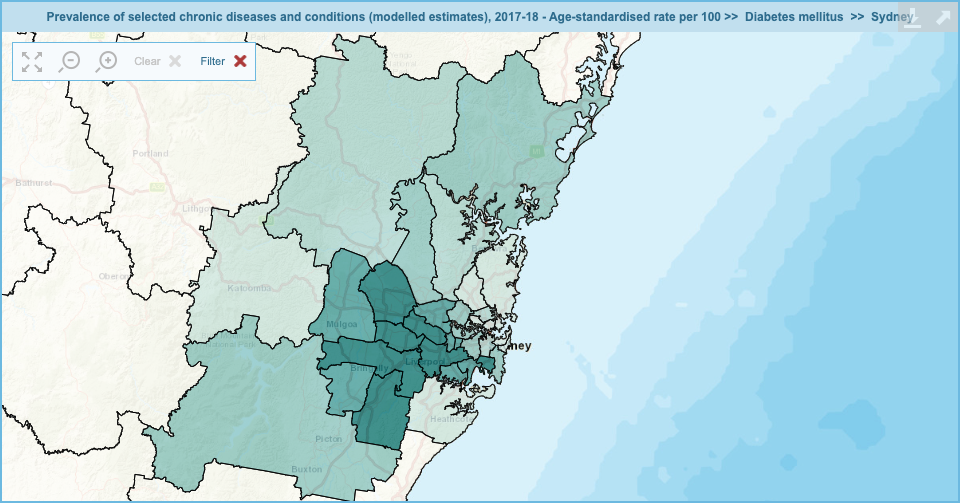
We know that non-communicable diseases like heart and artery disease, lung cancer, and diabetes all correlate strongly with disadvantage. It’s tempting to commit fundamental attribution error and assume that’s because poor people choose to smoke and eat bad food. And those are factors in causal pathways. But there’s a more nuanced explanation that I’ll cover in the conclusion to this post.
Not surprisingly, diabetes incidence correlates with disadvantage:
But when we come to mental health, the most disadvantaged areas have lower rates of diagnosed mental illness. Look:

The regression suggests there’s just 10% correlation between mental illness and disadvantage. Looking at the map, it’s likely that is because some relatively disadvantaged areas have high rates of diagnosis (top rim of LGAs), while others — the cluster I’m focused on — have very low rates.
Step 3: Interpretation and Discussion
Takehome: had anyone in the NSW Government talked with a health geographer for even five minutes, they would have known to target what we now call ‘LGAs of Concern’ with early intervention to promote understanding of restrictions, vaccine uptake, and Covid-safe work practices.
And that’s the charitable interpretation. The bleak interpretation is that many of my colleagues in public health view targeted outreach and early intervention as ‘special treatment’ for ‘people who should pull their own weight.’ Protestant values run deep in our health and social welfare responses. So they might in fact have considered taking those steps and decided against it.
(In case you think that sounds bitter, I have a book for you. I wouldn’t be working in health promotion if I were not a fundamentally optimistic person.)
We need to think carefully about some of the differences in health outcomes I’ve highlighted here. Many reflect differences in access to care. For instance, I don’t think people in Sydney’s West are more ‘mentally healthy’ than the rest: I think they have trouble accessing affordable mental health care, and you need that in order to get a mental health diagnosis in the first place.
But the pattern recurs with other outcomes like bowel cancer screening where testing is free and they literally post a test kit to your house. So it’s about where disease prevention and health promotion fit in lives under constant pressure: working in casual jobs, multiple jobs, no control over shifts, with family relying on your income. It’s about demands on your time as much as lack of money.
We hear demands for everybody to ‘JUST STAY HOME’ from twitter users who get their dinner and groceries delivered and don’t notice the contradiction in that. Our society depends upon a cohort of essential workers copping it in the neck. People who lack control over their lives can’t say no to working in unsafe conditions. They live where rents are cheapest and that drives the patterns we see in the geography of health and illness. We can spot those patterns from the moon, but we never intervene in ways that make a difference, because it would interfere with the exploitation dynamic that drives our capitalist economy.
But the migrant communities we’re (largely) talking about are incredibly resilient. They’re making lives in Australia out of a patchwork of income sources while supporting each other, bringing up kids and caring for elderly relatives here and in other countries. The best thing we could do is resource them to promote Covid-19 vaccination through their own activities and communication channels. We shouldn’t see them as targets or problems.
Further reading
- Also from me: ‘Lock down smarter, not harder‘ in Inside Story magazine
- Josh Nicholas, ‘“Magnifying glass” on inequality: why Covid is hitting harder in Melbourne’s disadvantaged areas‘ in The Guardian data blog
Hi Daniel, thanks for your blog. It’s good work. I stopped by to read ‘We ought’ve known’, and just kept on reading. I’ll be back.
May I offer what I hope is a helpful suggestion?
I notice the blog has a ‘subscribe’ button for email but no prominent link to the excellent RSS feed.
Since Alphabet inc. dropped support for RSS it has been on the decline, but it saves bandwidth, is a time saver and avoids mailbox clutter. It’s also a small way to resist the behemoths and honour Aaron Swartz.
https://boundaryobjects.blog/feed
Thanks for this important analysis and critique. I’ll be referring to it in a piece I am writing for nurses.